Gallup Data Reveals Sharp Drop in U.S. Gambling Participation Over Ten Years
Mara Hayes · Aug 23, 2026
Gallup Data Reveals Sharp Drop in U.S. Gambling Participation Over Ten Years
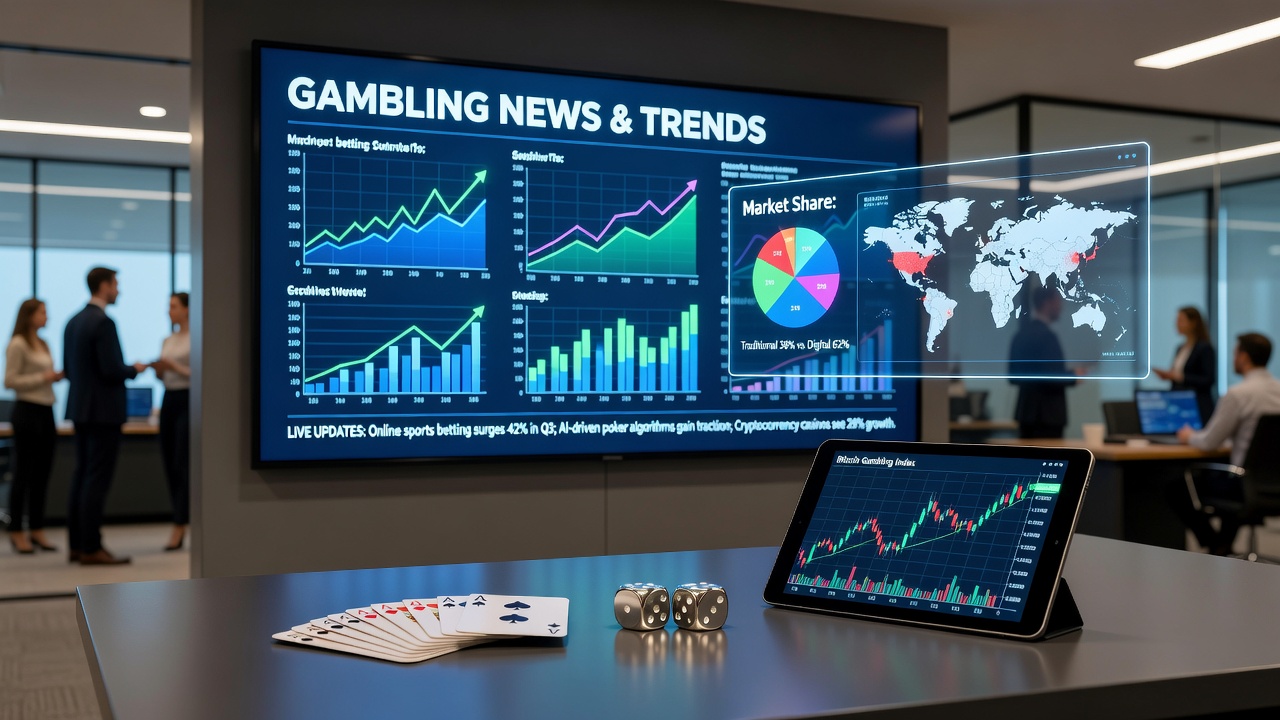
A Gallup survey released in August 2026 documents notable declines in how often American adults report taking part in several common gambling activities when compared with results from 2016, even as gambling apps and prediction markets have expanded their reach. The findings cover lottery ticket purchases, in-person casino visits, sports betting, and the newer category of prediction market platforms such as Polymarket and Kalshi.
Key Participation Shifts Documented
Data from the survey indicates lottery ticket purchases fell from 49 percent of adults in 2016 to 31 percent in 2026, while in-person casino visits dropped from 26 percent to 14 percent over the same period. Sports betting participation moved from 10 percent to 7 percent. Prediction market usage registered at 2 percent and did not offset the broader declines across other categories.
Observers note these percentages reflect self-reported behavior collected through consistent survey methods, allowing direct year-over-year comparisons. The ten-year span includes periods of regulatory change in multiple states along with the introduction of mobile platforms that some anticipated would increase overall engagement.
Survey Context and Methodology
The August 2026 release presents results gathered from a nationally representative sample of American adults, mirroring the approach used in the 2016 iteration. Researchers collected responses on frequency of participation in specific activities rather than total dollars wagered or hours spent. This focus on participation rates provides a clear view of how many people engage at all, separate from intensity among those who do participate.
Figures reveal that the declines appear across multiple activity types, suggesting the pattern is not limited to one segment of the market. Lottery participation showed the largest absolute drop in percentage points, yet casino visits experienced a similar proportional reduction relative to the earlier baseline.
Role of Prediction Markets
Although prediction markets have gained visibility in recent years, the survey places their usage at 2 percent among adults. This level remains too low to counterbalance the measured reductions elsewhere. Platforms such as Polymarket and Kalshi operate in a distinct regulatory space from traditional sportsbooks and lotteries, yet the data shows limited crossover into mainstream adult participation at this stage.
Broader Market Environment in 2026
State-level expansions of legal sports betting and the growth of online lottery sales occurred during the decade covered by the two surveys. Despite these developments, the reported participation rates moved downward. Analysts tracking the industry have pointed to the survey as one indicator among several that overall engagement patterns may differ from earlier projections tied to digital access alone.
The survey does not measure total handle or revenue generated by operators, focusing instead on the share of adults who report any involvement. This distinction matters because concentrated activity among fewer participants could produce different financial outcomes than widespread but light participation.
Comparison With Earlier Trends
Ten years earlier, the same Gallup questions captured higher involvement across the listed activities. The 2016 numbers aligned with a period when fewer states offered legal sports betting and mobile options remained more limited. The 2026 results arrive after several years of state-by-state legalization and the rollout of new digital products, creating a contrast that researchers continue to examine.
Those who have followed gambling policy note the survey provides a longitudinal view rather than a snapshot, which helps separate short-term fluctuations from longer-term shifts. The consistent methodology supports such comparisons while leaving room for additional studies on demographic or regional differences.
Conclusion
The August 2026 Gallup survey supplies concrete figures showing reduced adult participation in lottery, casino, and sports betting activities relative to 2016 levels. Prediction market usage stands at 2 percent and has not reversed the overall direction. The data, drawn from repeated survey instruments, offers a factual baseline for ongoing discussion about how Americans interact with available gambling options. Gallup survey on American gambling participation (2026 vs. 2016 comparison) remains the primary source for these participation percentages.